These notes are from the Practical session.
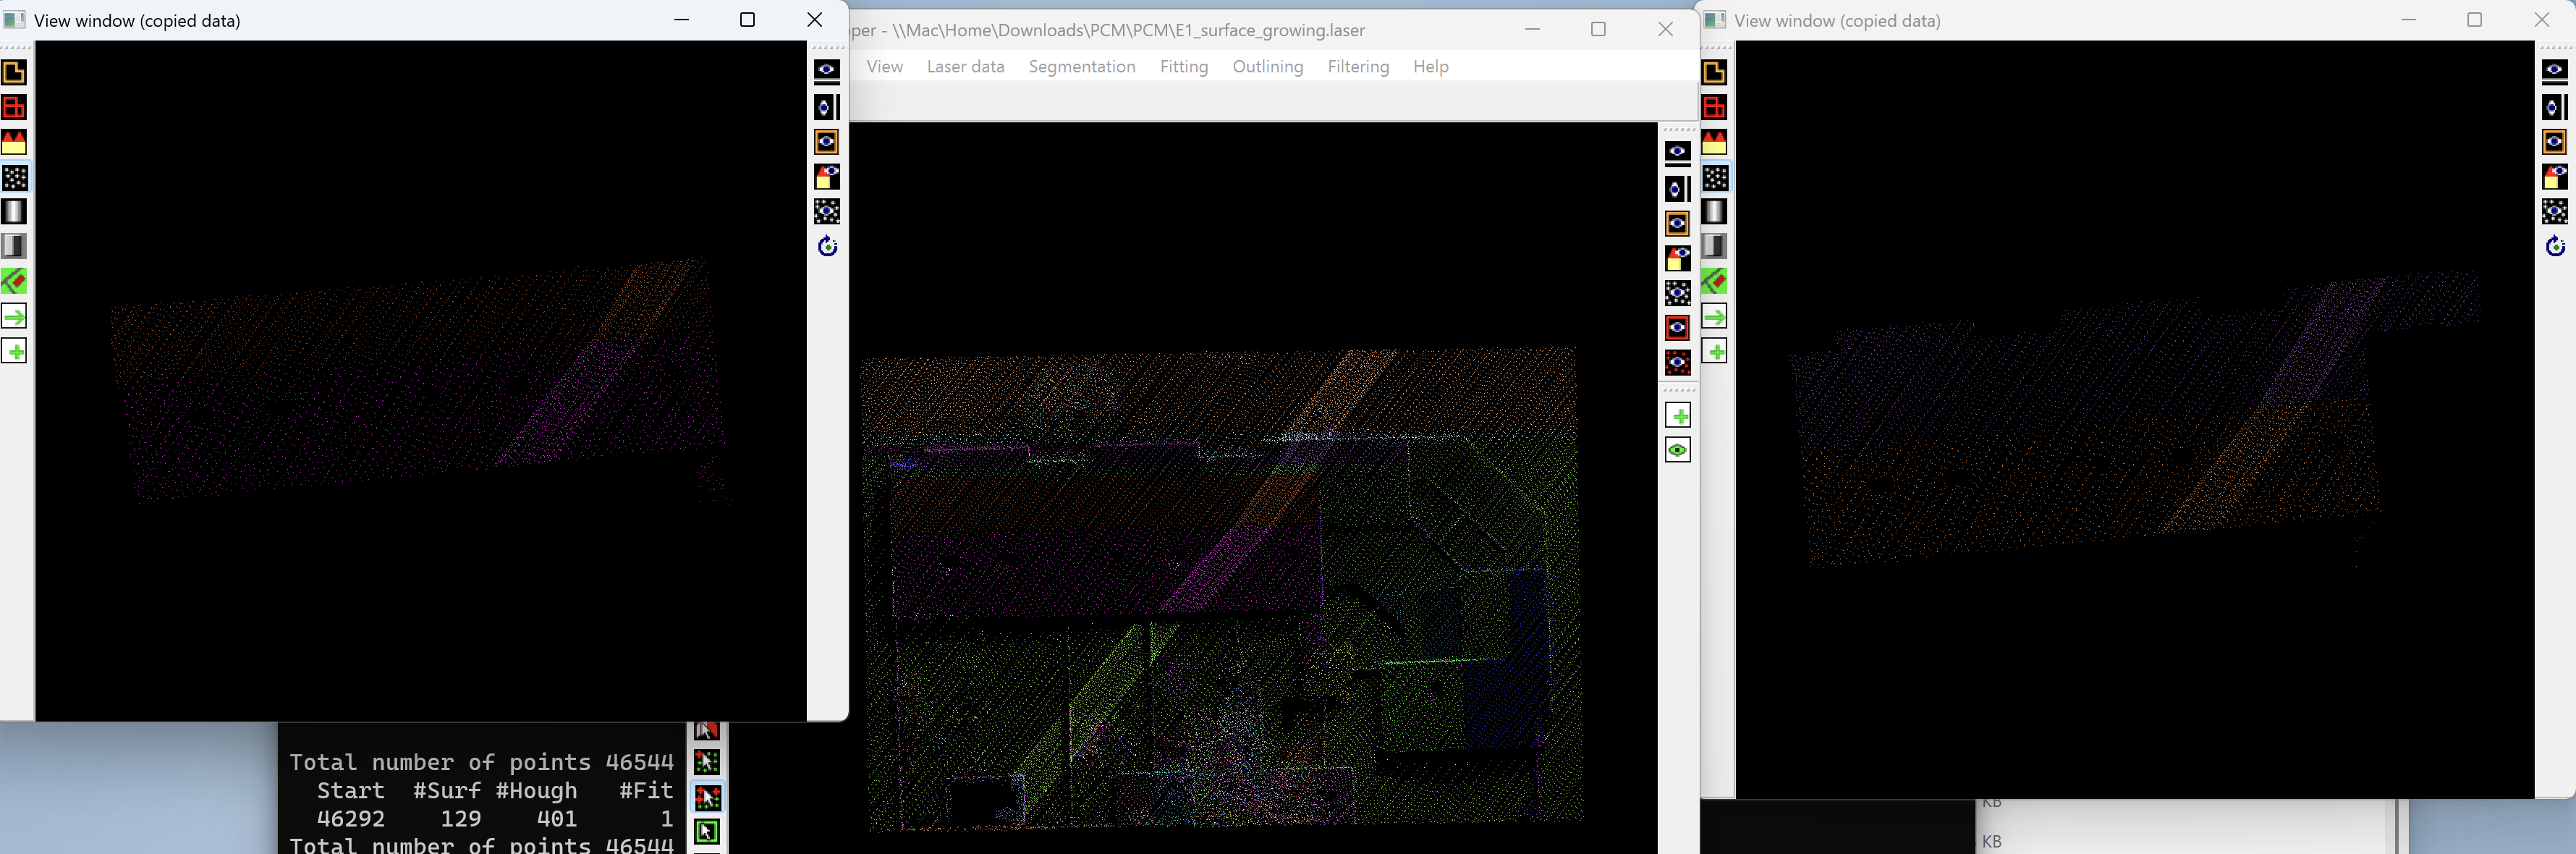
In the images George showed us, there was a middle line that was brigher. It simply shows that the point density was higher in the middle region. So it was higher in the flight direction and lower across the flight direction. This software (Point cloud mapper), was entirely done by George in C++. Waay back in the days. And it goes without saying that many enterprises and organizations make use of it. Insane!!
Task 1: Surface growing
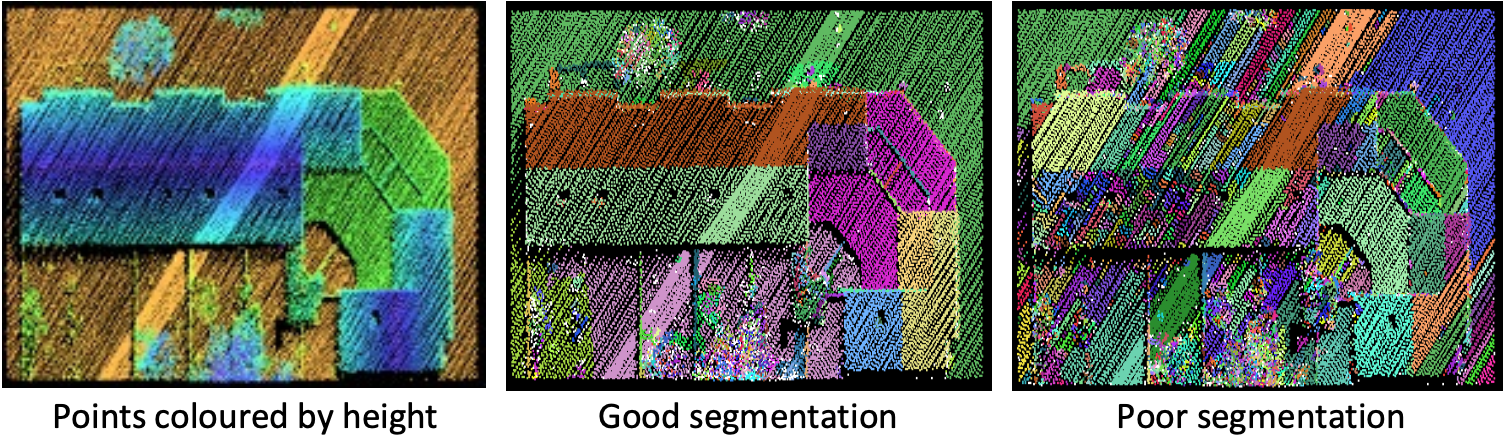
The extraction of planar faces is the first step in many procedures for 3D modelling of buildings. The left picture below shows a point cloud of a building (and some fences and vegetation) coloured by height. In the other two pictures, the points have been coloured by segment number. Points that were recognised to be in the same planar face were given the same segment number. In the case of the middle picture, the segmentation has been successful. All planar roof faces have been correctly identified. The right picture shows an example of an over-segmentation. Due to non-optimal parameter settings, many roof faces are split into multiple segments.
Q1: What is the lowest value you can use for these maximum distances without causing an over-segmentation of the roof surfaces? Use the same maximum distance value for the seed detection and the growing stage
Q1: 0.6 is pretty much the limit where you get over segmentation on the roof
Compare the trees in the segmentation result with the determined maximum distance value to the trees in the segmentation with the default parameters. What difference do you observe?
Q2: The difference in the trees comes from the fact that now only 6 points per region get selected, not 30? I think that was it, look in the document. Yeah, that was it. Since less points per region get selected, the trees are getting trimmed. It will make sense once I cover the segmentation lecture.
Set the parameter values back to the default ones. Then reduce the surface growing radius to 30cm
Why do you obtain an over-segmentation on some of the roof surfaces?
Q3: If a point is accepted in a segment, it will only look towards points that are within 30 cm of that point. That’s why we get different segmentations. One point is enough to connect a region to another! You asked about the middle region.
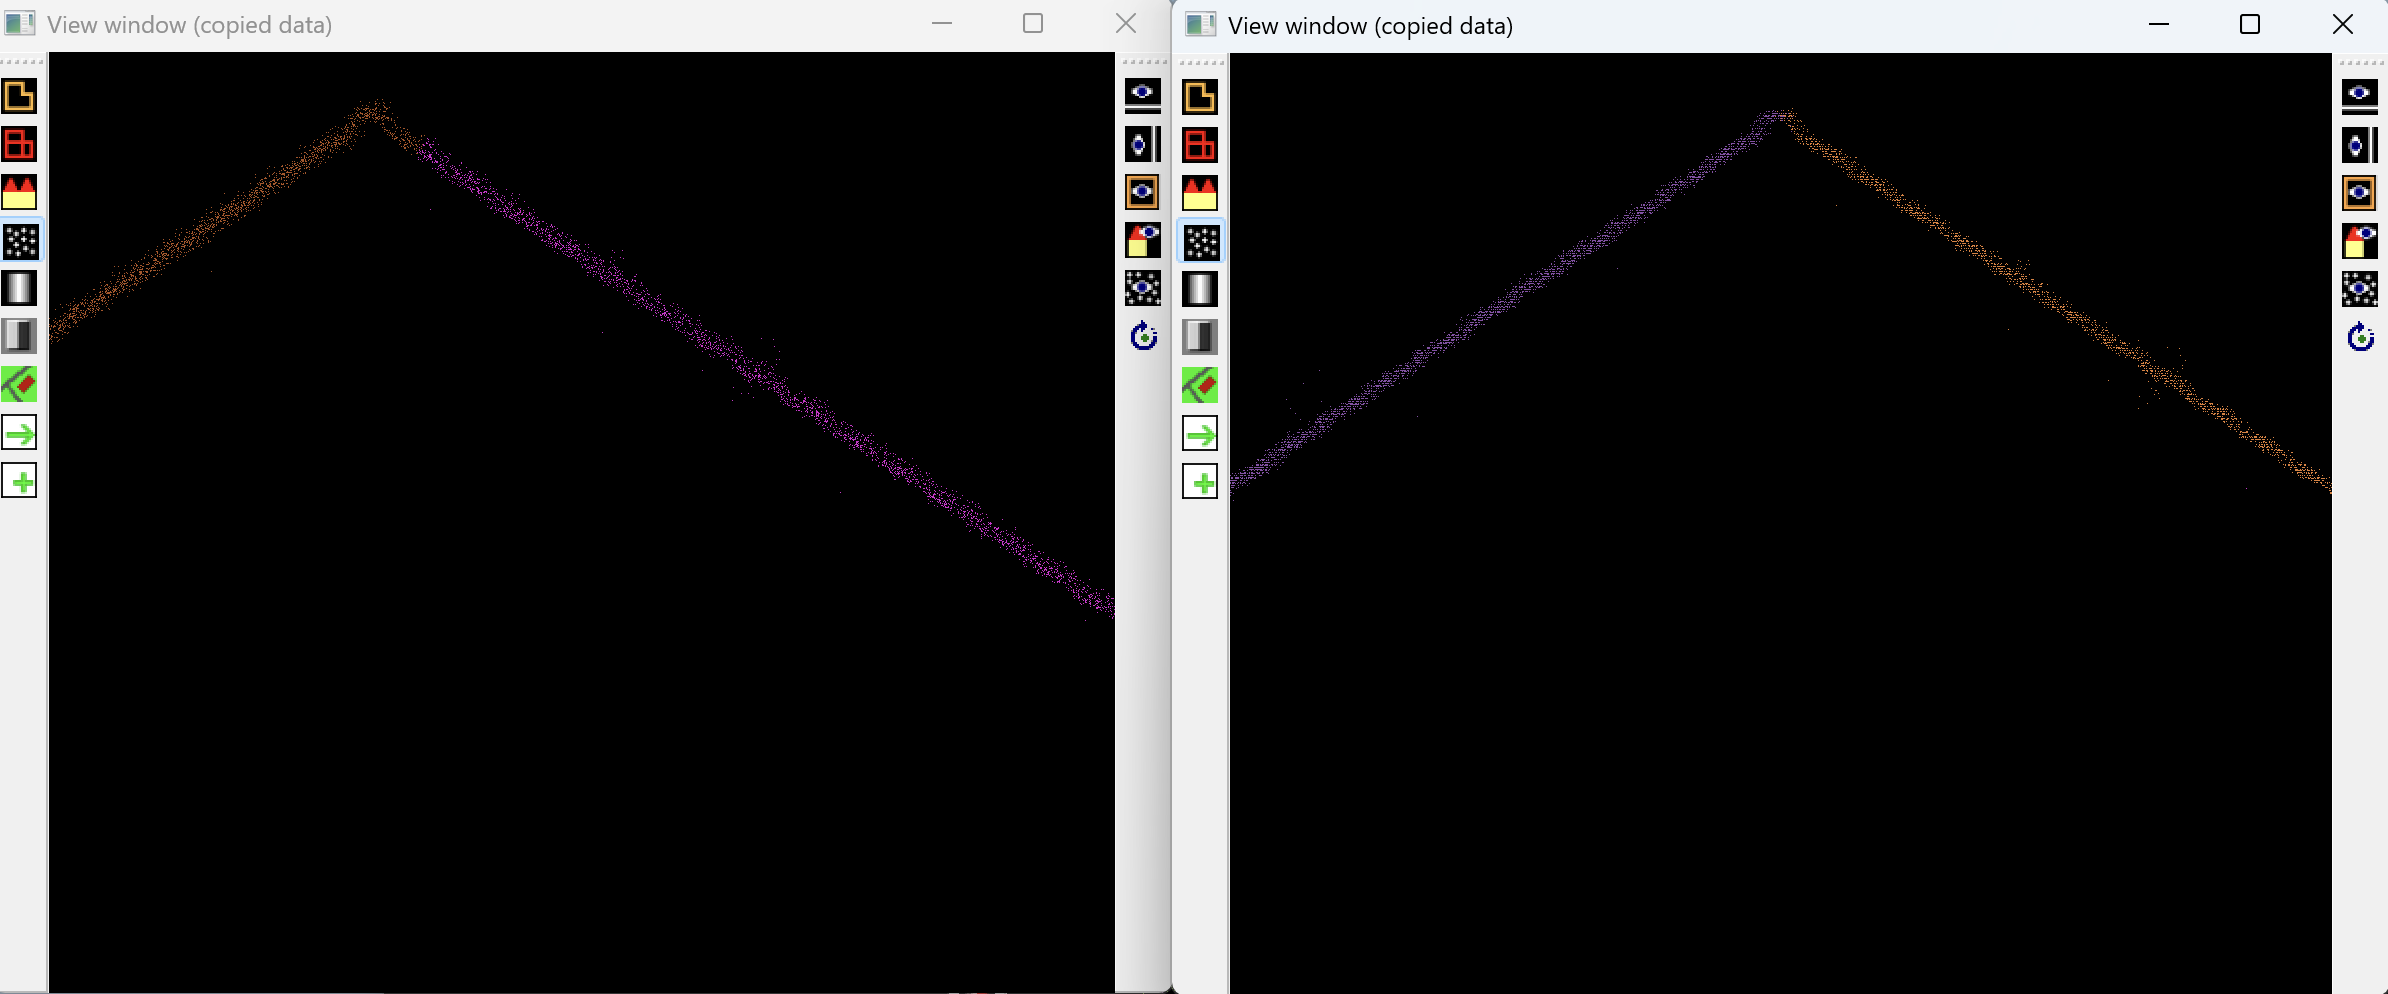
Set the parameter values back to the default ones. In the next experiment, we examine the use of the competing surfaces switch. Run the surface growing with the default parameters. Select the two segments of the largest gable roof.
How do the two results compare? What’s the reason for the result in the last experiment?
Q4: The simple greedy operation on the right side will grow a segment until there’s no further point. As soon as a point has a segment label, it will keep that segment label. On the left side, you think “where does the point fit best?”, which is much better.
If you look from the side, you can also see how the right one redecided on the allocation of the point to which segment.
How would the result change if you would increase the “maximum distance to surface” to e.g. 0.6 in the surface growing parameters?
Q5: It would take more points from the roof to the left side.
Task 2: Extracting street furniture
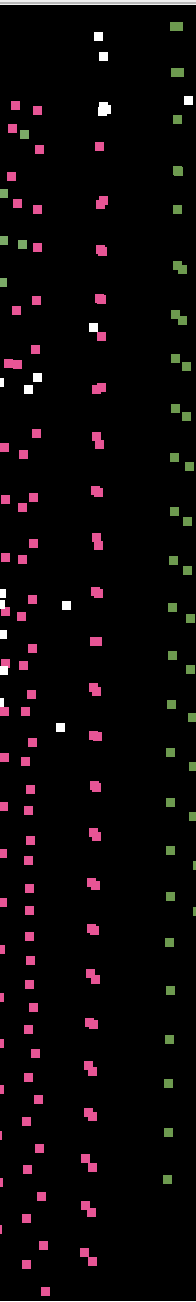
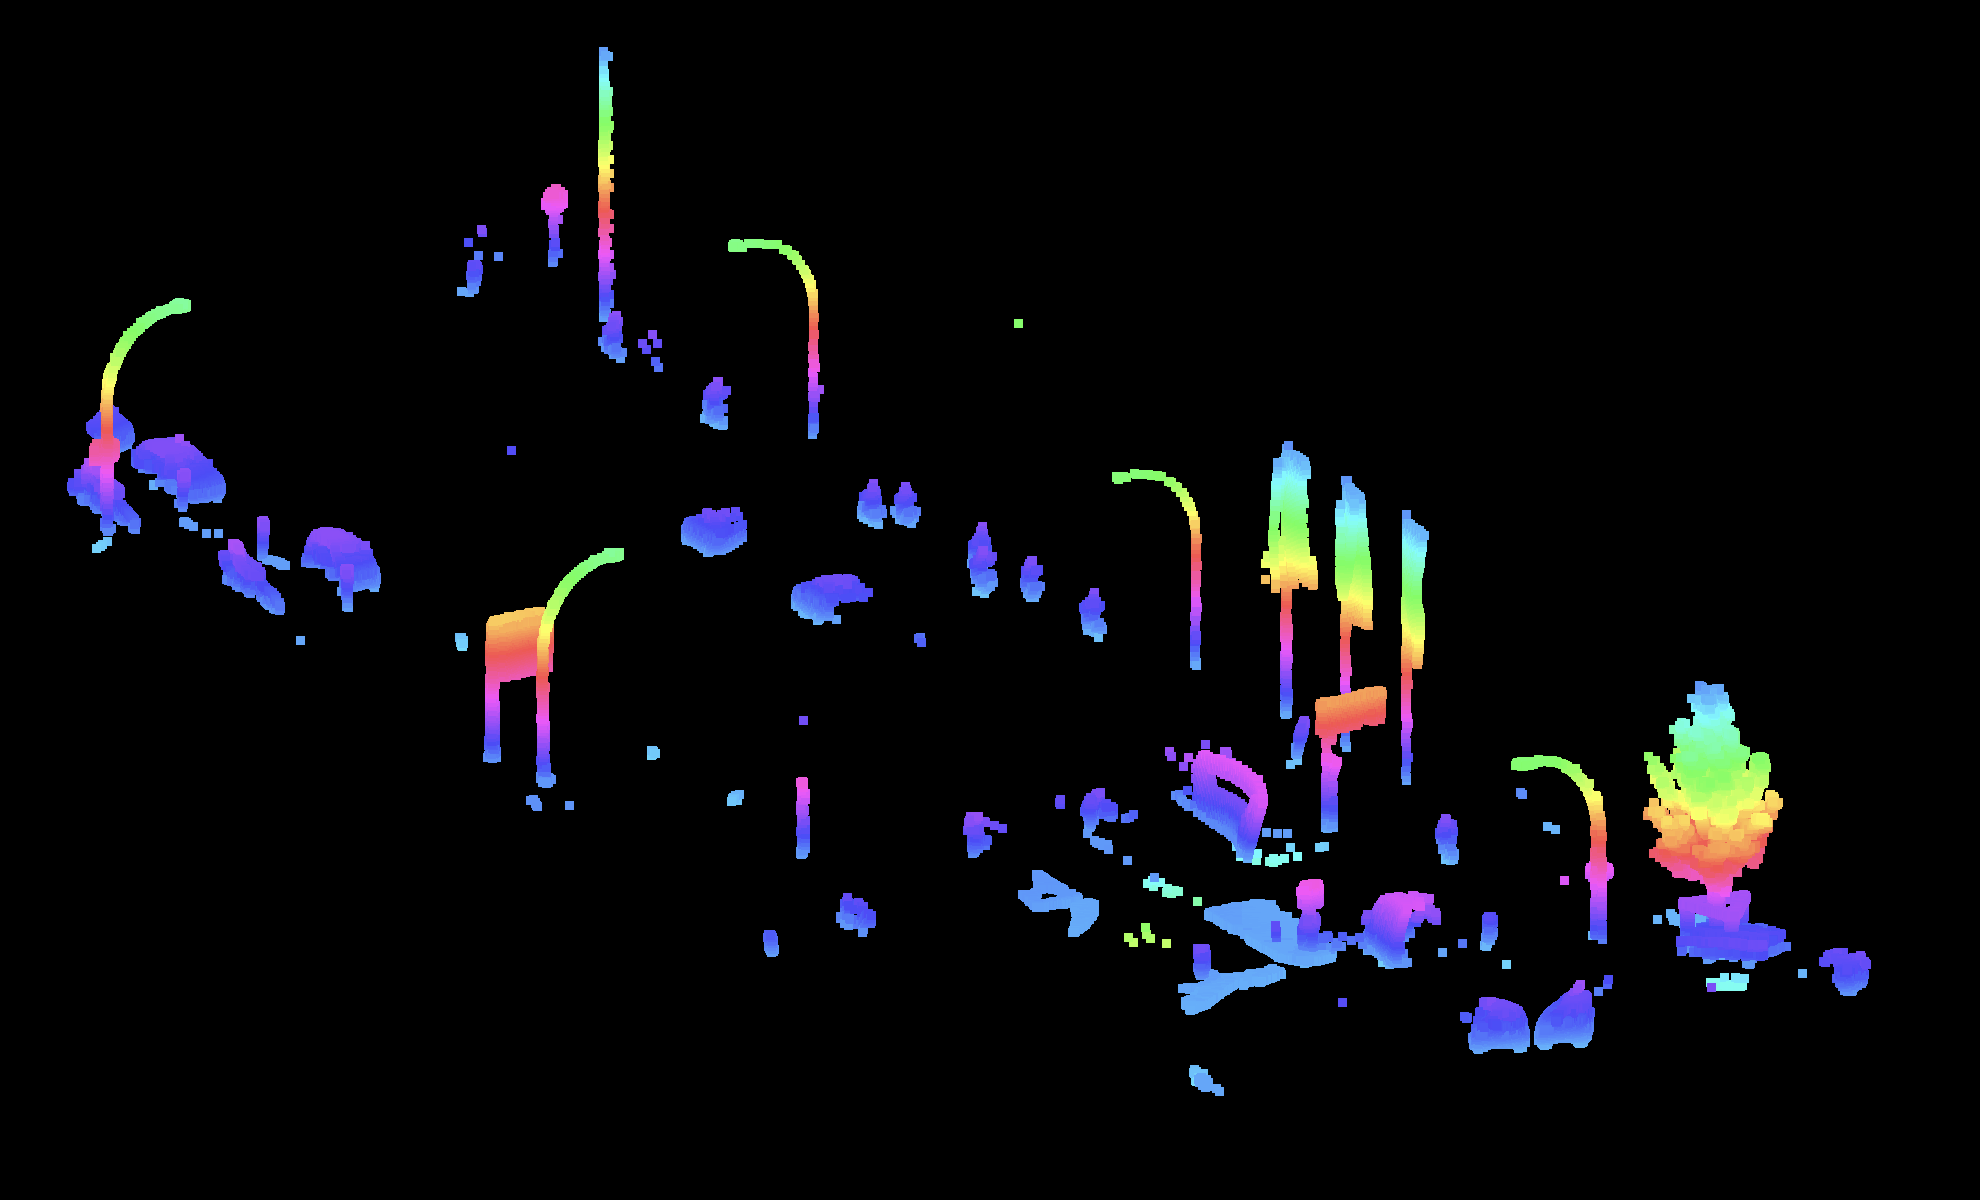
We had a piece of a point cloud obtained by Mobile Laser Scanning (MLS). My task is to process this point cloud such that the points belonging to the same piece of street furniture are given the same segment number and the points on the ground have been removed. This is shown in the right figure.
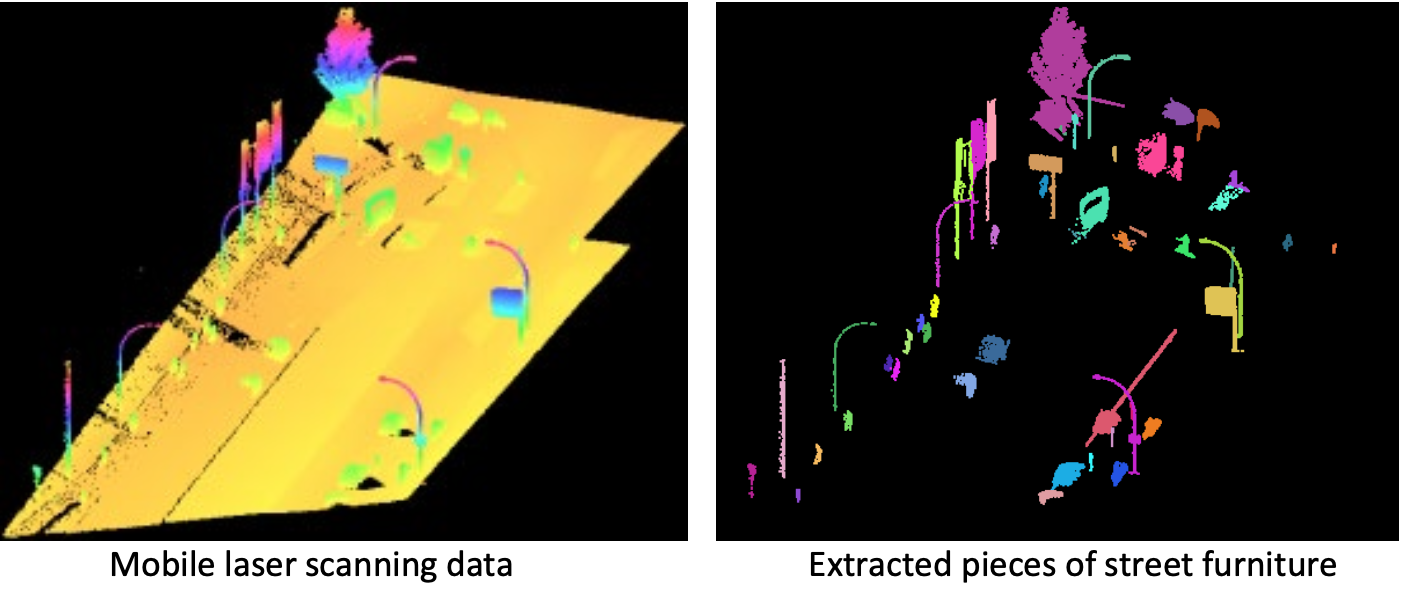
Which sequence of operations allows you to extract the street furniture?
Q6: What I did was to “Maximum distance to surface” & “Maximum distance to plane”, and after I selected the regions, I deleted them with keyboard d. But in this case, I get narrower trees, for example. What I can also do, is select with a selection the lower part(the street), delete it, and then take the “connected components”.
I have a list with all the hotkeys if I press ’?’
Task 3: Segmenting multi-line scanner data
Multi-line scanners like Velodyne scanners are often used for understanding the road environment to support autonomous driving. A single scan recorded as part of the KITTI dataset was available.
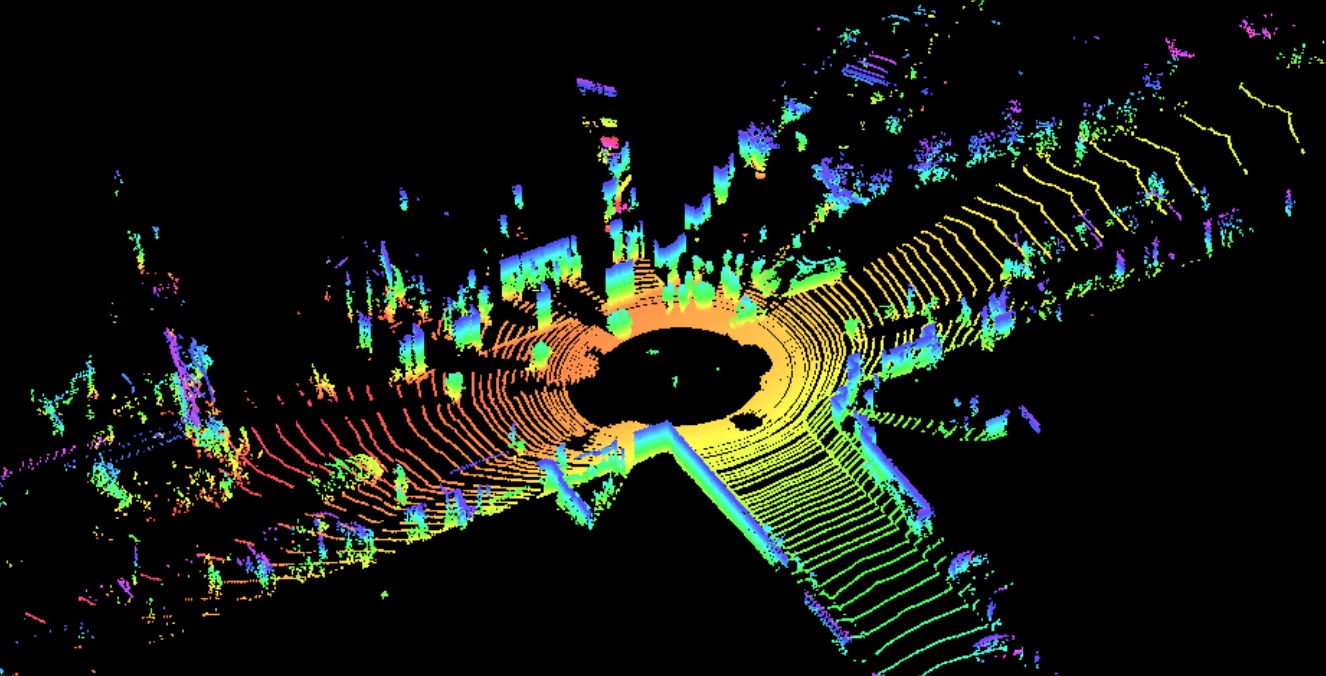
What makes the segmentation of this dataset harder than the segmentation of the two previous datasets?
Q7: The irregular point spacing of the dataset is causing challenges. Understand what Triangulation is!!!!! He talked a lot about it. You can also view it in the software.
If you press “l(L small letter)”, and select “show neighborhood lines”, then you can see the triangulation.