The goal is learning = class, where the neighborhood provides context.
Traditional point cloud classification is based on
- Point based classification
- Segment based classification
- Map based
Deep learning classification of course makes use of networks such as PointNet, PointNet++, RandLA, KPConv, etc.
What kind of label could we have?
- stop sign
- person
- wall
- buildings, etc
Compared to pixels, a point is a 3D points + potential labels like reflectance and pulse count. In both cases, context comes from neighborhood.
Traditional Methods
This one includes calculating labels per point based on point-based attributes and context from the local neighborhood.
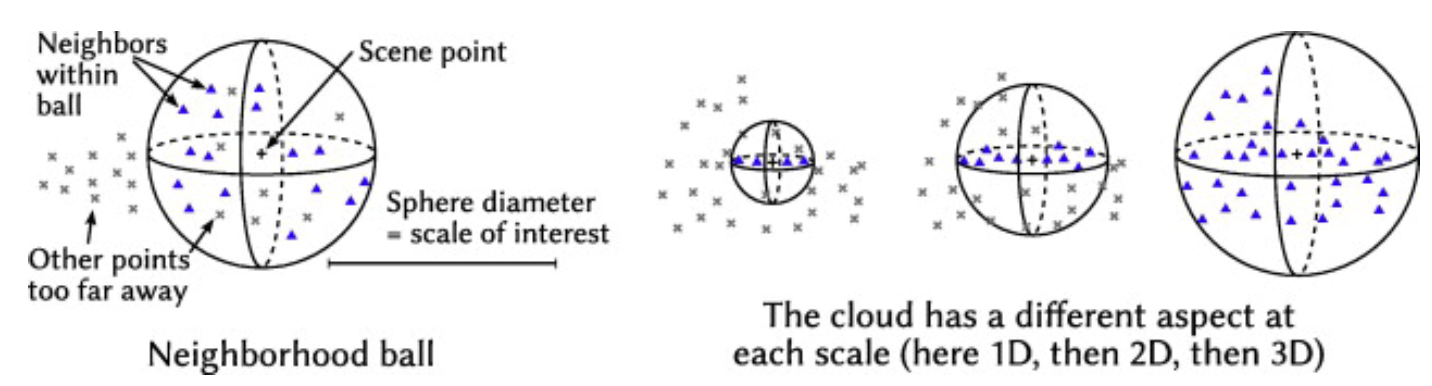
How to choose your neighborhood?
Point Based Classification
We could use features such as planarity or linearity, or other properties like absolute/relative height of neighborhood.
One concept I see is the “ball query” concept covered in PointNet — for each center, grab all points within a radius .
Point Based pipeline suggested in Weinmann et al 2015
3D Raw Point Cloud Neighborhood selection Feature Extraction Feature Selection Supervised Classification Labeled 3D Point Cloud
Segment Based Classification
Basically determine label of a segment and then assign that label to each point within the segment.
Segment Based pipeline
Points Segmented Points Attributes/Features per segment Classify Segment
- So basically do segmentation and then extract features based on that?
Supervised versus Unsupervised Classification
- Supervised
- Training samples are selected to determine signature per class
- Manual selection and labelling of training samples
- Tune parameters, possibly feature selection
- How to improve results? — change training sets, modify classifier, adopt a confidence interval
- Unsupervised
- No training samples needed
- Labelling by rules, or assignment after clustering
Map Based Classification
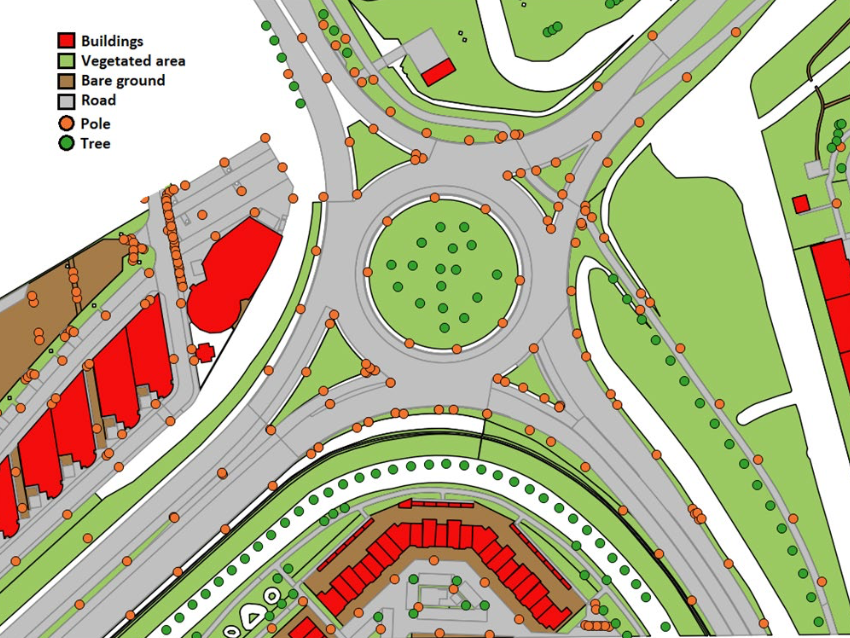
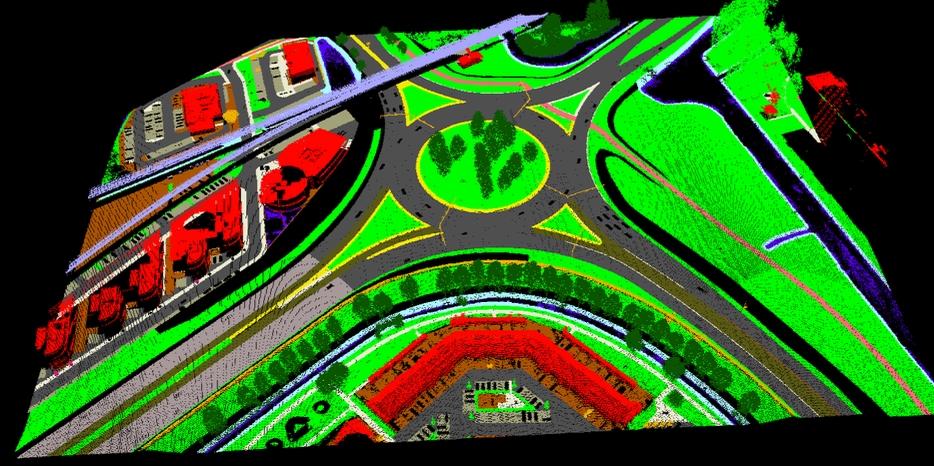
This process involves fusing the map with the point cloud and then use the fused product as training labels in any supervised classification algorithm.
Deep Learning Methods
They learn those features automatically, as each layer is able to focus on a different aspect of the point cloud.
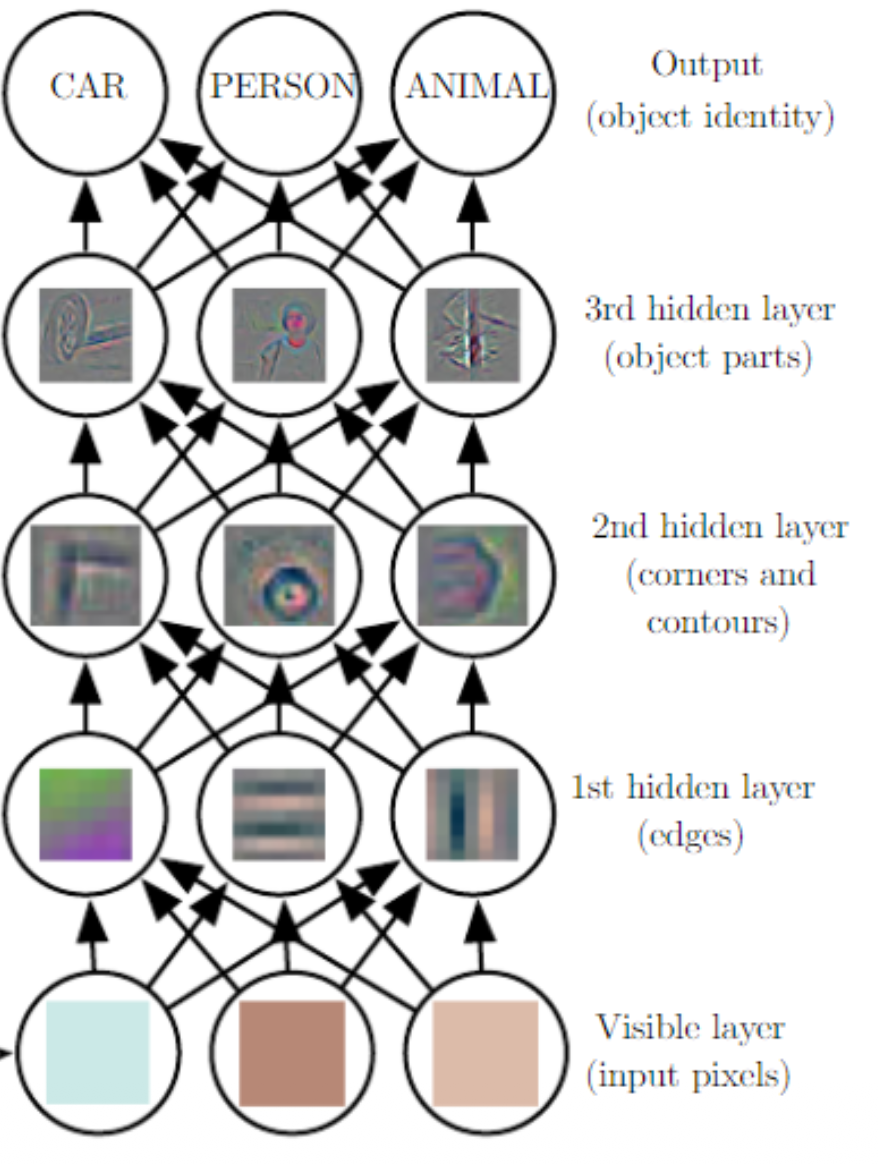
The output of a CNN is called feature map. However, I feel like these should fail since it’s order sensitive. These methods need non-linearity to be able to generalize. That’s why we include ReLU activation functions or pooling.
Two solutions for CNNs are covered: KPConv places kernel points in a 3D ball around each point, making the operation order-invariant; RandLA-Net uses random sampling + attentive pooling, trading some accuracy for ~200x speed improvement.
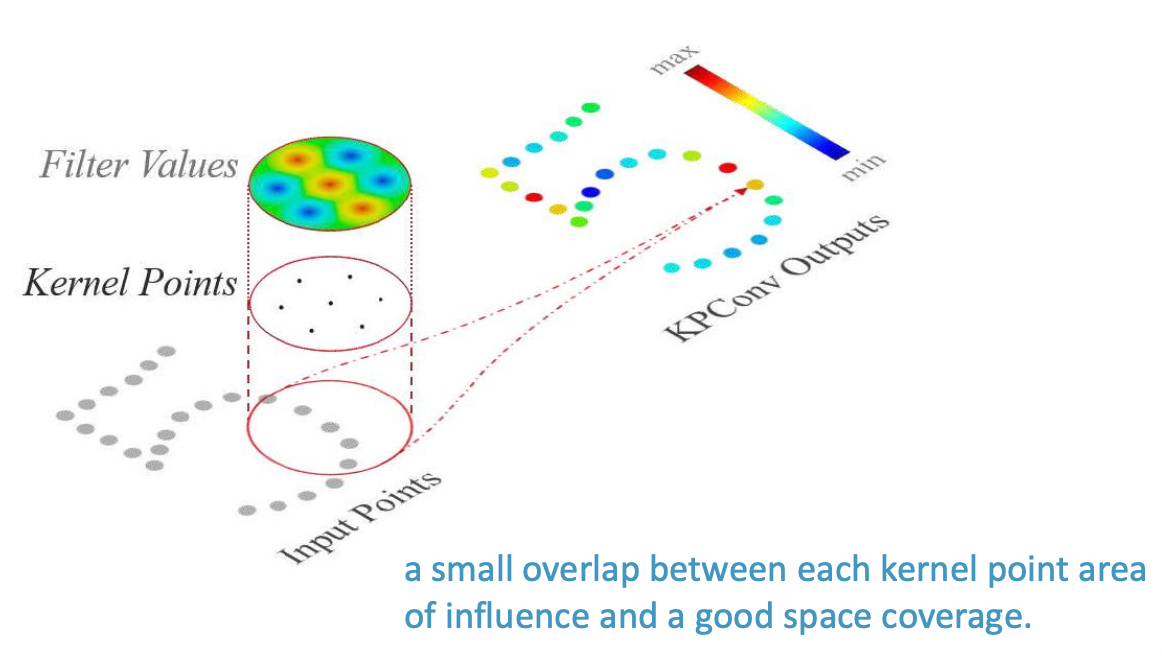
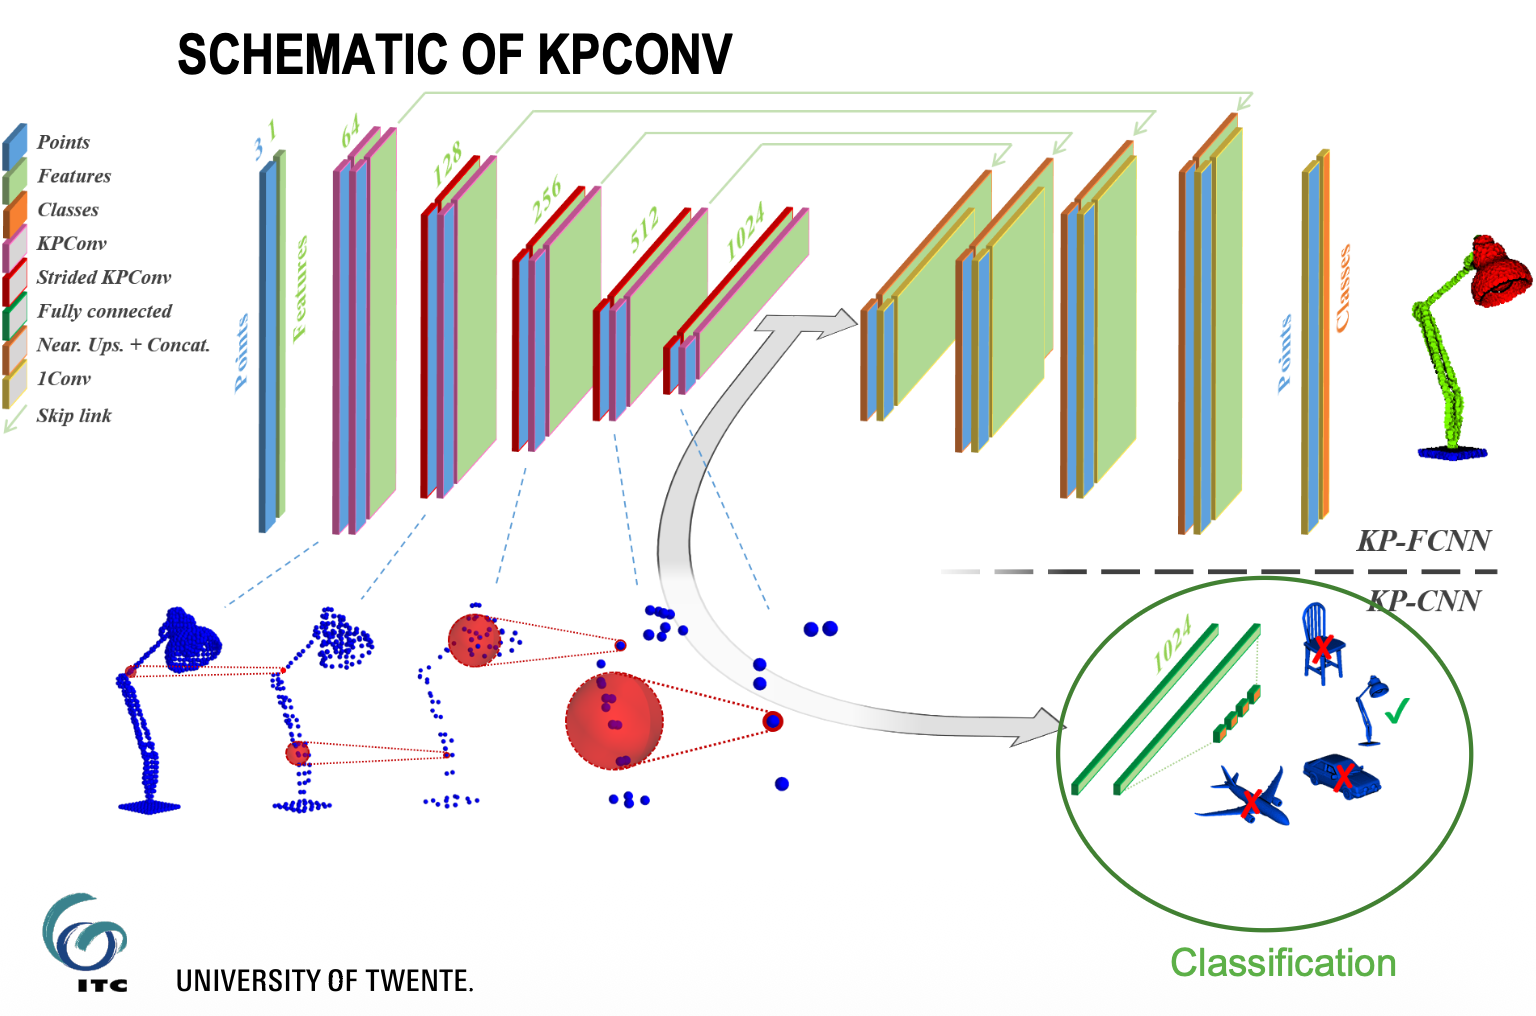
Limitations of KPConv include millions of parameter, resulting in the method being slow.
This can either work in 2D (point cloud image) or in 3D (voxels).
Could M be just a matrix with size , where is the number of points?
No, cuz the matrix encoding discards spatial relationships and is sensitive to point ordering.
How to include all the dimensions in the analysis? Apparently Deep Learning
So we are looking for a function that outputs the class for point . Typically, it also depends on its neighborhood ⇒ . How do I select the neighborhood? I think I can do it with kNN.
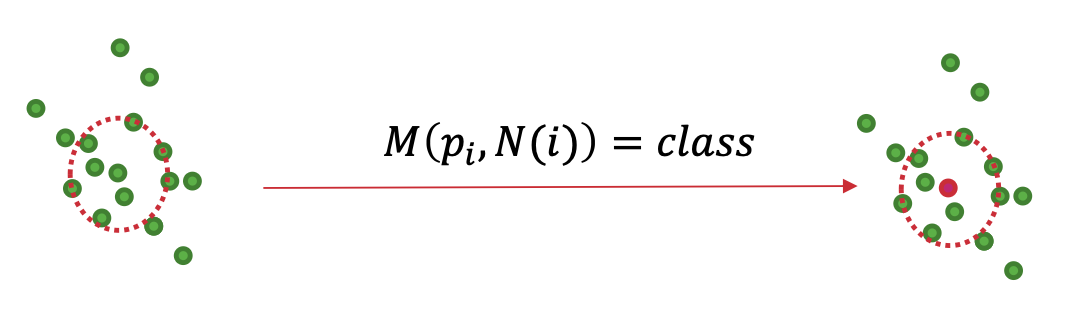
Turning features into classes
Through affine transformations (linear). , , …
But linearity fails on non-linearity separable data. So we can just use . I know from PointNet that the function is symmetrical. It’s important to keep the invariant property.
You can stack ReLU functions to create a really complex approx function. Insert the slide with the triangle. Apparently, it’s a norm?
How to sample the neighborhood of a point?
Computational Efficiency is still a problem. The neighborhood selection can be done with the ball query idea from PointNet. What’s the fastest way to downsample down to K points? Apparently it’a combination of random sampling and attention mechanism. See “RandLA-Net: Efficient semantic segmentation of large-scale point clouds”.
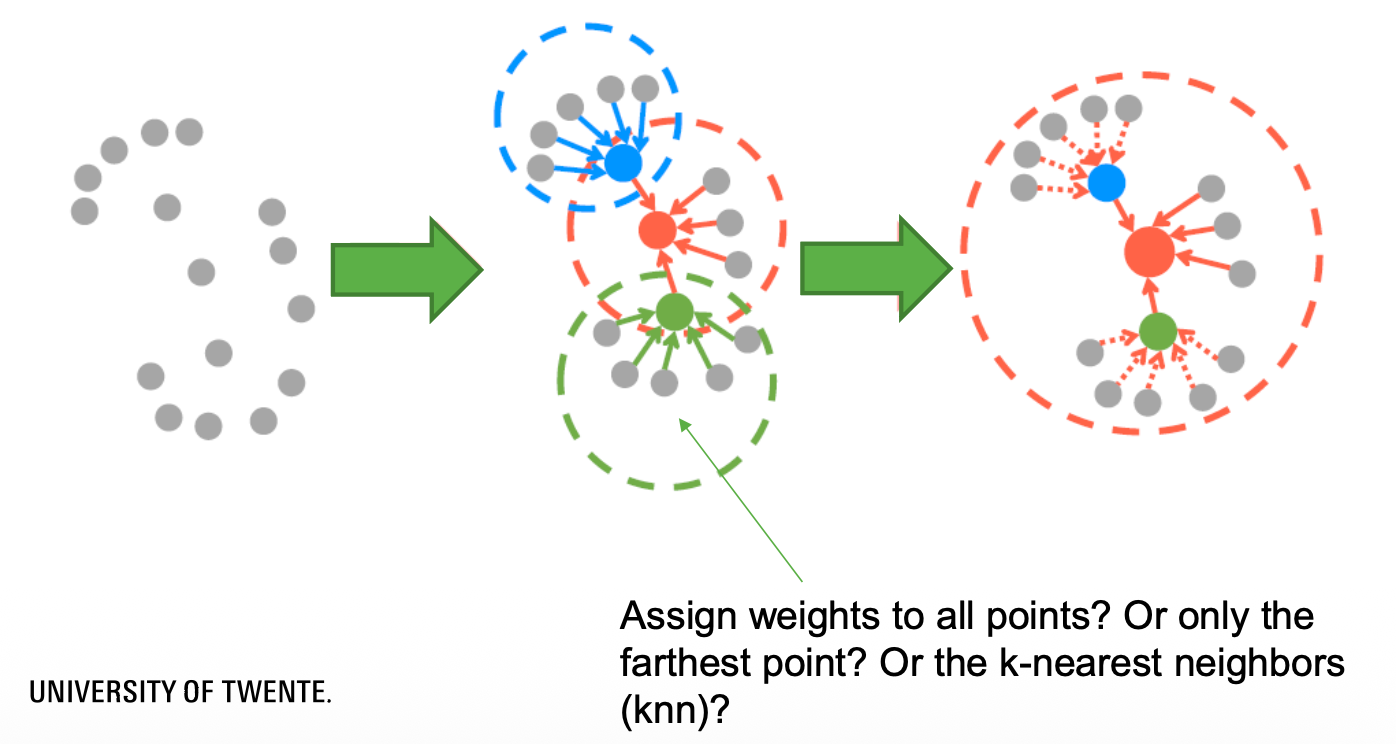
- Each point aggregates features from K random neighbors.
- Attentive pooling weights neighbors by learned importance.
There’s a drawback. What if you have 90% of ground in your point cloud? That’s what the attentive pooling is solving. However, the accuracy suffers from the random sampling.
Receptive Field: all the data that was used to compute the features aggregations. With each layer, the receptive field grows. Research this concept more :)
One challenge might be classes that look very similar.
READ THAT PAPER! Results are quite insane
Current models are only based on transformers. Also read Brodu and Lague, 2012.
Questions
- Why is representing a point cloud as a plain N×K matrix insufficient for spatial analysis? What information is lost?
This one goes back to the idea that matrix representations are not suitable for point clouds since they are unordered sets. Matrix encoding discards spatial relationships and is sensitive to point ordering.
- Briefly explain two feature calculation techniques. With what kind of data are sampling techniques needed and why?
Sampling techniques are needed for large-scale data (millions of points, >100m×100m areas) because deep networks can’t process everything at once — they need progressive downsampling per layer without losing important features. Complete this answer with two techniques.
- Why does stacking multiple linear layers without a non-linearity not improve expressive power? Use a mathematical argument.
Affine transformations are typically of the form , , etc. However, the problem is that stacking these linear transformations results in something still linear: . Therefore, we are unable to learn non-linear representations of the data. We could fix this by using a nonlinear activation function such as — as it introduces non-linearity by “folding” the feature space, breaking the linear collapse.
- Convolution is straightforward for pixel and voxel grids. Explain with your own words how can convolution be applied to unordered 3D point clouds?
This concept is covered in KPConv which places kernel points in a 3D ball around each point, making the operation order-invariant. A good practice is to ensure a small overlap between each kernel area and good space coverage.
- What is the trade-off between KPConv and RandLA-Net in terms of speed and accuracy, and what causes it?
KPConv wins in accuracy and loses in speed in comparison to RandLA-Net. It wins in accuracy since the convolution is usually able to generalize the data pretty well, while the RandLA-Net relies on random sampling where each point aggregates features from K random neighbors and via Attentive pooling, it weights neighbors by learned importance. This random sampling is in itself a drawback and affects the IoU score (Intersection over Union) since it could potentially discard important points wheras KPConv considers all neighbors through the kernel. RandLA-Net wins in speed (~200x faster) since the convolution requires millions of parameters.
- A point cloud is sometimes described as “unordered.” Explain what this means and give one concrete consequence for algorithm design.
Point Clouds are 3D points defined by their (x,y,z) coordinates in space plus extra feature channels such as color, normal etc. However, they are natively unordered. I cannot tell you anything about two points other than that they are at different positions. If we’re talking about images, pixel order matters. So, point clouds are unordered sets (no reason why point #1 comes before #47), and therefore they require some modifications when we talk about algorithm design. One popular choice is the max pooling which is a symmetric function which collapses many values into one like this: . It helps with picking the most prominent features from the point cloud with the result being a single global fixed-size feature vector that summarizes the entire point cloud, regardless of how many points there were. While this narrows down the point cloud, we still miss local structure. For example, PointNet++ does Farthest Point Sampling — pick N “center” points that are spread out across the cloud, apply the Ball Query concept — for each center, grab all points within a radius , and then apply PointNet to each local cluster which results in one feature vector per cluster.