Lecture from Data Science. It targets discovering patterns, correlations, anomalies, insights and trends from large datasets. The purpose is to gain insights for decision-making, prediction, and knowledge discovery.
We want to find patterns that are
- Valid: the pattern holds not only in the data we looked at, but also in new, unseen data
- Useful: the pattern can be acted upon or helps decision-making.
- Unexpected: the pattern is not completely obvious beforehand.
- Understandable: humans can interpret and communicate the pattern.
There are two types of data mining methods.
Supervised Learning
- train a model to predict or estimate outputs
- labeled training data
Applications include
predict credit card fraud, estimate property prices, convert handwritten images to text
Regression
The output is continuous (e.g. price, blood pressure)
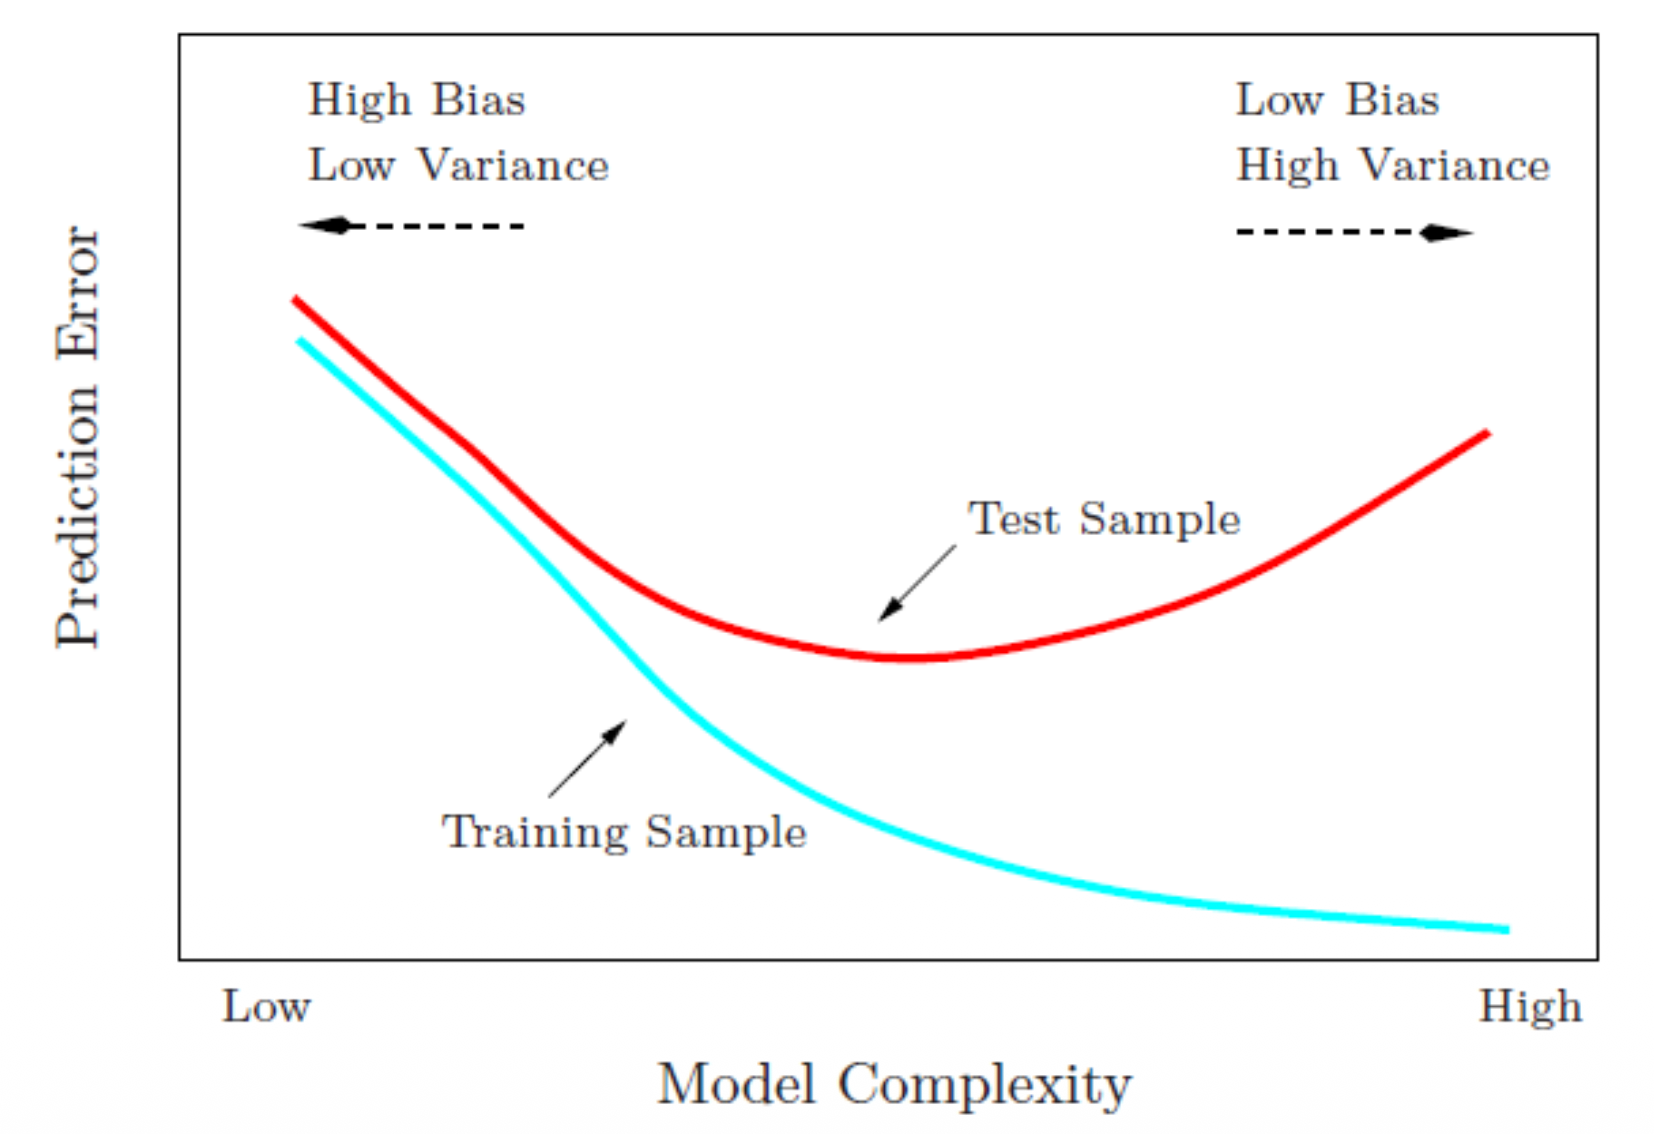
We can make a model more complex by adding more parameters (higher polynomials to fit the data, more hidden layers). However, we risk to overfit the training set since it will learn the noise.
We can make a model too simple, and then we underfit by not learning the underlying patterns which results in poor performance on training and new data.
Bias-Variance trade-off
- Complex model ⇒ low bias, high variance
- Simple model ⇒ high bias, low variance
Terminology
- Irreductible error — the part of the error we cannot model; can only be reduced by improving or adding more data
- Variance — how much the model’s predictions would change if we trained it on different datasets
- Bias — the error introduced when the model’s form cannot capture the true relationship
- Mean Squared Error
- How we model affects the balance between bias and variance
Performance measures
Common performance measures for regression quantify how close the predicted values are to the actual values:
- RMSE
- MAE
- R-squared
Regression methods
- K-Nearest Neighbors (KNN)
- Regression trees
- Random forest
Classification
The output is categorical and based on a predicted probability (binary classification — yes/no, multi-class classification — more than two classes).
Decide for each task below whether it's a classification or a regression problem
- Predict gender of a person from handwriting — classification
- Predict house price based on area — regression
- Predict the nationality of a person — classification
- Predict whether stock price will increase — classification
- Predict probability of survival after hip fracture — regression
- Predict whether a patient survives after hip fracture — classification
basically, ask yourself what the output is. numerical ⇒ regression, a class ⇒ classification
Classification methods (binary/multi-class)
Unsupervised Learning
- explore relationships and structure in data
- unlabeled training data
Applications include
discover product associations, cluster patients by symptoms, spam email detection
Unsupervised Learning Methods
- PCA
- Clustering methods:
- K-means clustering — partition data into K similar groups
- Hierarchical clustering — build a tree of nested clusters
Clustering
Validation
The validation of a model in statistics is the task of evaluating whether a chosen statistical model is appropriate or not.
always on unseen data to avoid overfitting.
types of validation:
- external: using completely new data
- internal: using part of the available data
- training/test splits
- cross-validation
- K-fold
- bootstrap
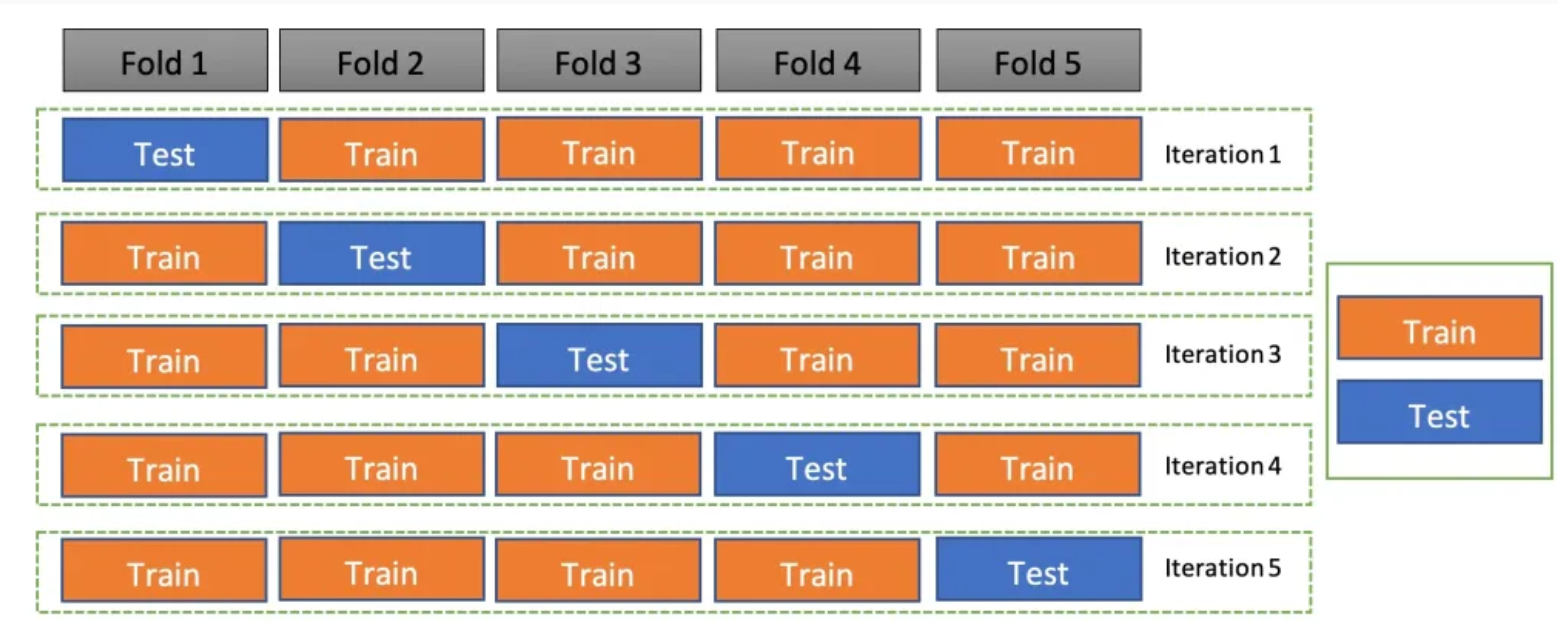
K-fold cross-validation
- split the data into equal parts
- Train the model on parts and test on the remaining part
- Repeat times, each time using a different part as test set
- Each data point is used times for training and once for testing
- Calculate performance measures for each fold
- Average the K results to get the final performance estimate
Performance Measures from Confusion Matrix
| Assigned class | |||
|---|---|---|---|
| Positive | Negative | ||
| Actual Class | Positive | TP | FN |
| Negative | FP | TN |
- Accuracy - percentage correctly classified
- Sensitivity/Recall/True positive rate
- Precision/Positive predictive value
- Specificity/True negative rate
- -score - balance between Precision and Recall
However, these performance measures usually have their threshold set at 0.5. Changing it also changes how examples get classified.
ROC Curve
Receiver Operating Characteristic (ROC) curve
plots True Positive Rate (TPR) against False Positive Rate (FPR) for different thresholds
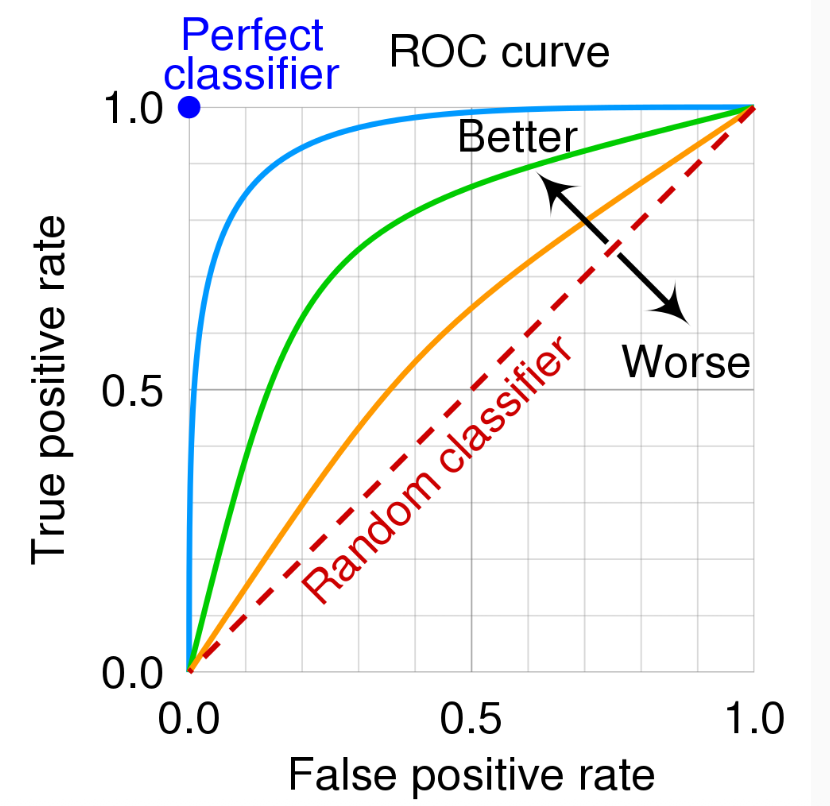
Area Under the Curve (AUC) is the overall measure of model performance, independent of the threshold. It’s also interpreted as the probability that the model ranks a random positive example higher than a random negative example.
- It’s threshold-independent, so it’s useful for comparing models overall, before you’ve picked a specific cutoff.