Nadaraya-Watson based on an input .
The Nadaraya-Watson model applies the concept of kernel density estimation to solve continuous regression problems, allowing us to predict a target variable
Instead of just estimating the distribution of the inputs, this model first evaluates the joint probability distribution of both the inputs and the targets. It achieves this by centering a kernel function, denoted as , on every single training data pair and summing them up.
To make a prediction for a new input , the model computes the conditional probability density . As shown in the equations, this is done by taking the joint distribution and dividing it by the marginal distribution (the integral of the joint distribution over all possible values of ).
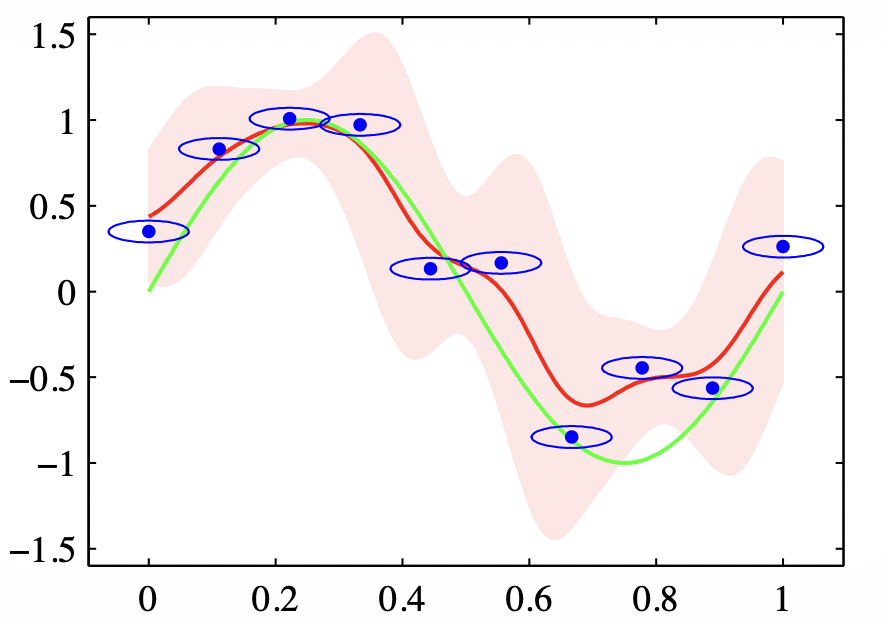
- The blue dots represent the given training data points.
- The ellipses drawn around each dot represent the individual kernels placed directly on those observations.
- The green curve shows the true underlying function, while the red curve shows the model’s predicted expectation (the regression line) derived from the kernels.
- The pink shaded region visualizes the spread of the conditional probability density , illustrating the model’s predictive uncertainty at different points along the x-axis.