Read Section 9.2 and Chapter 15 of Elements of Statistical Learning, 2017
A decision tree is a hierarchical classifier (or regressor) built by recursively splitting the feature space on one variable at a time. The representation for the CART model is a binary tree.
The selection of which input variable to use and the specific split or cut-point is chosen using a greedy algorithm to minimize a cost function.
- Greedy Splitting recursive binary splitting.
- At each node you try every question, keep the one with the most gain, and repeat until a stopping criterion
CART
CART for Regression
the cost function is the sum squared error (SSE) across all training samples that fall within the class.
CART for Classification
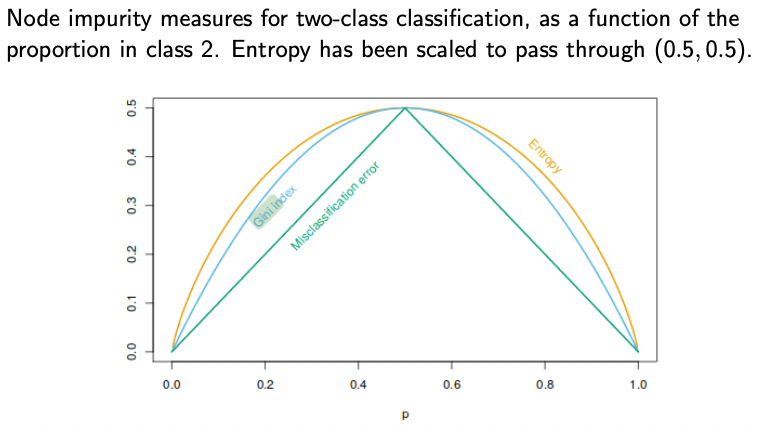
The Gini index is an indication of how “pure” the leaf nodes are.
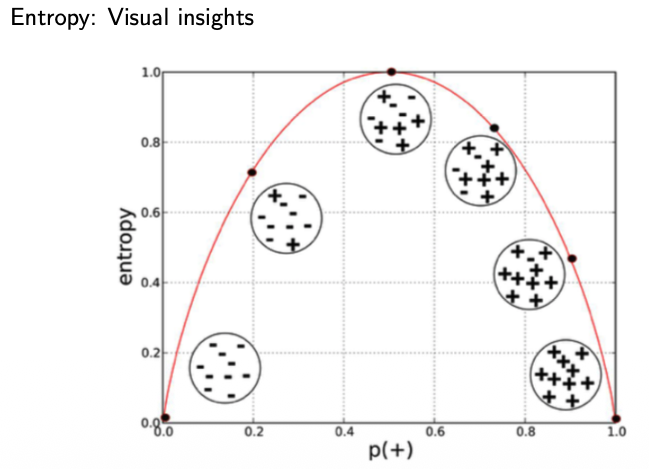
Impurity: chance of being incorrect if you randomly assign a label to an example in the set. Impurity measure examples:
- Entropy
- Gini index
- Misclassification error (fraction you’d get wrong if you guessed the majority):
See Decision Tree Practical to understand how to pick the root node using the Gini index and how to compute the information gain.
ID3
builds a decision tree for the given data in a top-down fashion. At each node of the tree, one property is tested based on maximizing information gain and minimizing entropy, and the results are used to split the object set. This process is recursively done until the set in a given sub-tree is homogenous.
- greedy search. selects using the information gain criterion, and then never explores the possibility of alternate choices.
- it does not handle numeric attributes and missing values i.e. only handles categorical data.
is a information gain of example set on attribute .
- is the proportion of belonging to class
- is each value of all possible values of attribute
- is the subset of for which attribute has value
- is the number of elements in , is the number of elements in .
IDE3 algorithm
Suppose is a set of 14 examples in which one of the attributes is wind speed. The values of Wind and be
WeakorStrong.The classification of these 14 examples are 9
YESand 5NO.For attribute Wind, suppose there are 8 occurences of
Wind=Weakand 6 occurences ofWind=Strong.For
Wind=Weak, 6 of the examples areYESand 2 areNO. ForWind=Strong, 3 areYESand 3 areNO.
Continuous variables are turned into threshold questions like "", which raises computational cost and overfitting risk. The idea is to reduce the tree complexity in order to improve generalization and prevent overfitting. Read here.
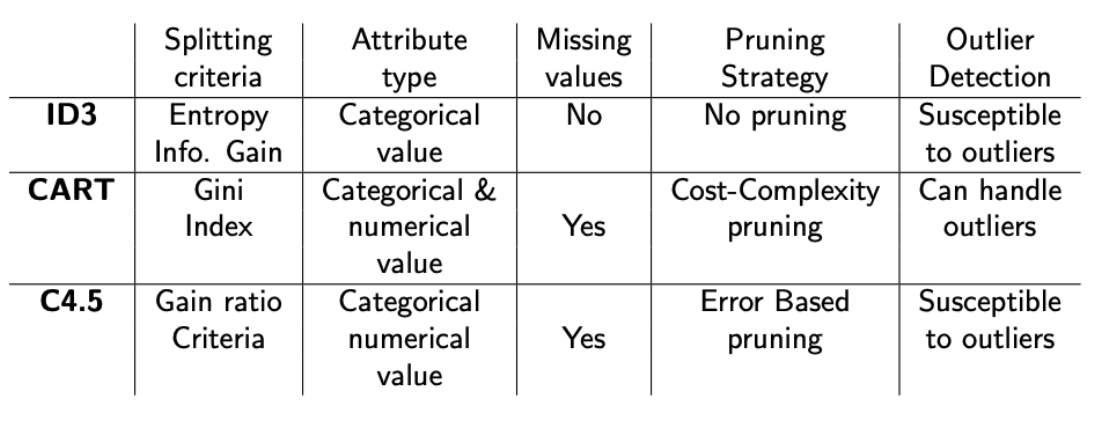
CART is always binary, while C4.5 can make a multiway split on a categorical attribute, with one branch per value. Also, the gain ratio is information gain divided by the “split information” (the entropy of how the split divides the data) — it penalizes attributes with many distinct values.
Ensemble methods
Improved NETFLIX’ recommendation engine more accurate in 2006.
Bias-Variance trade-off
- Complex model ⇒ low bias, high variance
- Simple model ⇒ high bias, low variance
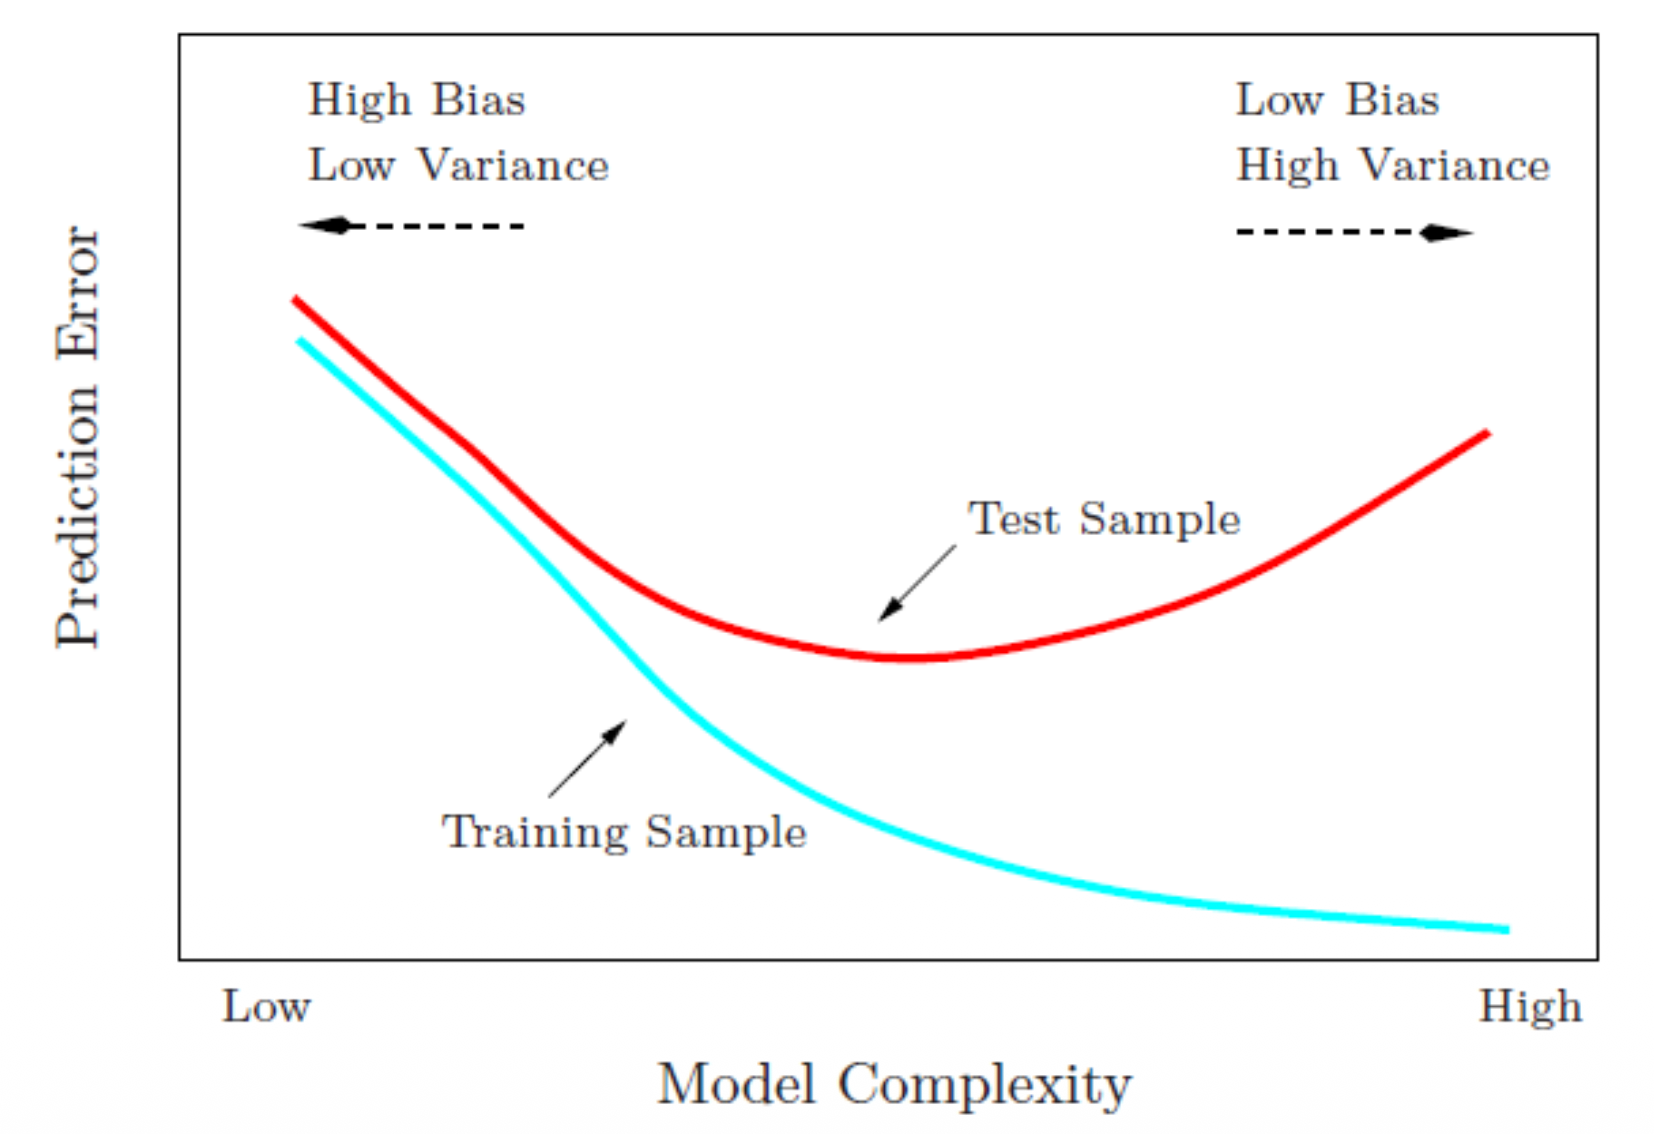
We can reduce variance without increasing bias through averaging.
Where do multiple models come from? There's only one training set.
Bootstrap Aggregation (Bagging) — reduce variance
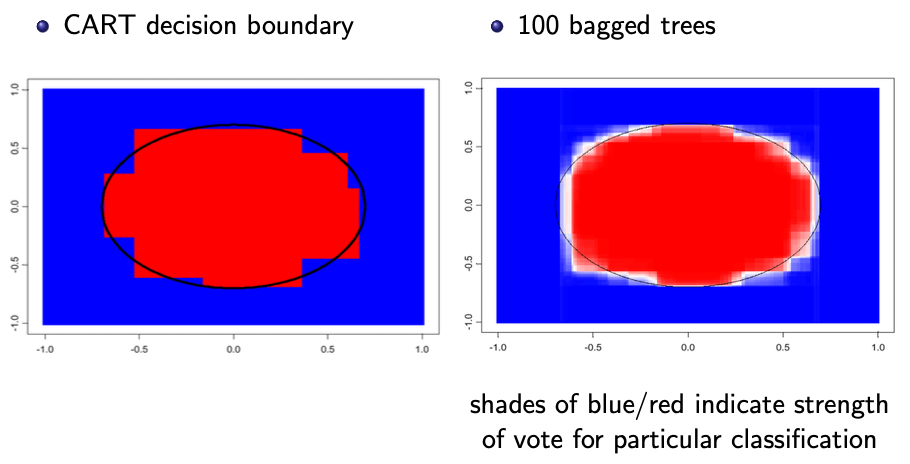
Random Forest: at each node, best split is chosen from a random sample of attributes instead of all attributes.
Boosting: combine several weak learners to form a stronger one. The main ones are adaptive boosting (Adaboost) or gradient boosting.